Docs · Getting started · Examples · Journal


Rust crates for building language servers. Your analysis runs once, in one engine, and an LSP server, an MCP server and a CPU and memory profiler all read from it.
cargo add lspkit lspkit-server| Crate | What it gives you |
|---|---|
lspkit | EngineApi and its types, plus config, vfs, sidecar and, behind treesitter, tree-sitter helpers. |
lspkit-server | JSON-RPC LSP scaffolding on lsp-types: capabilities, dispatch, diagnostics, progress, cancellation, live file watching and, behind mcp, the MCP adapter. |
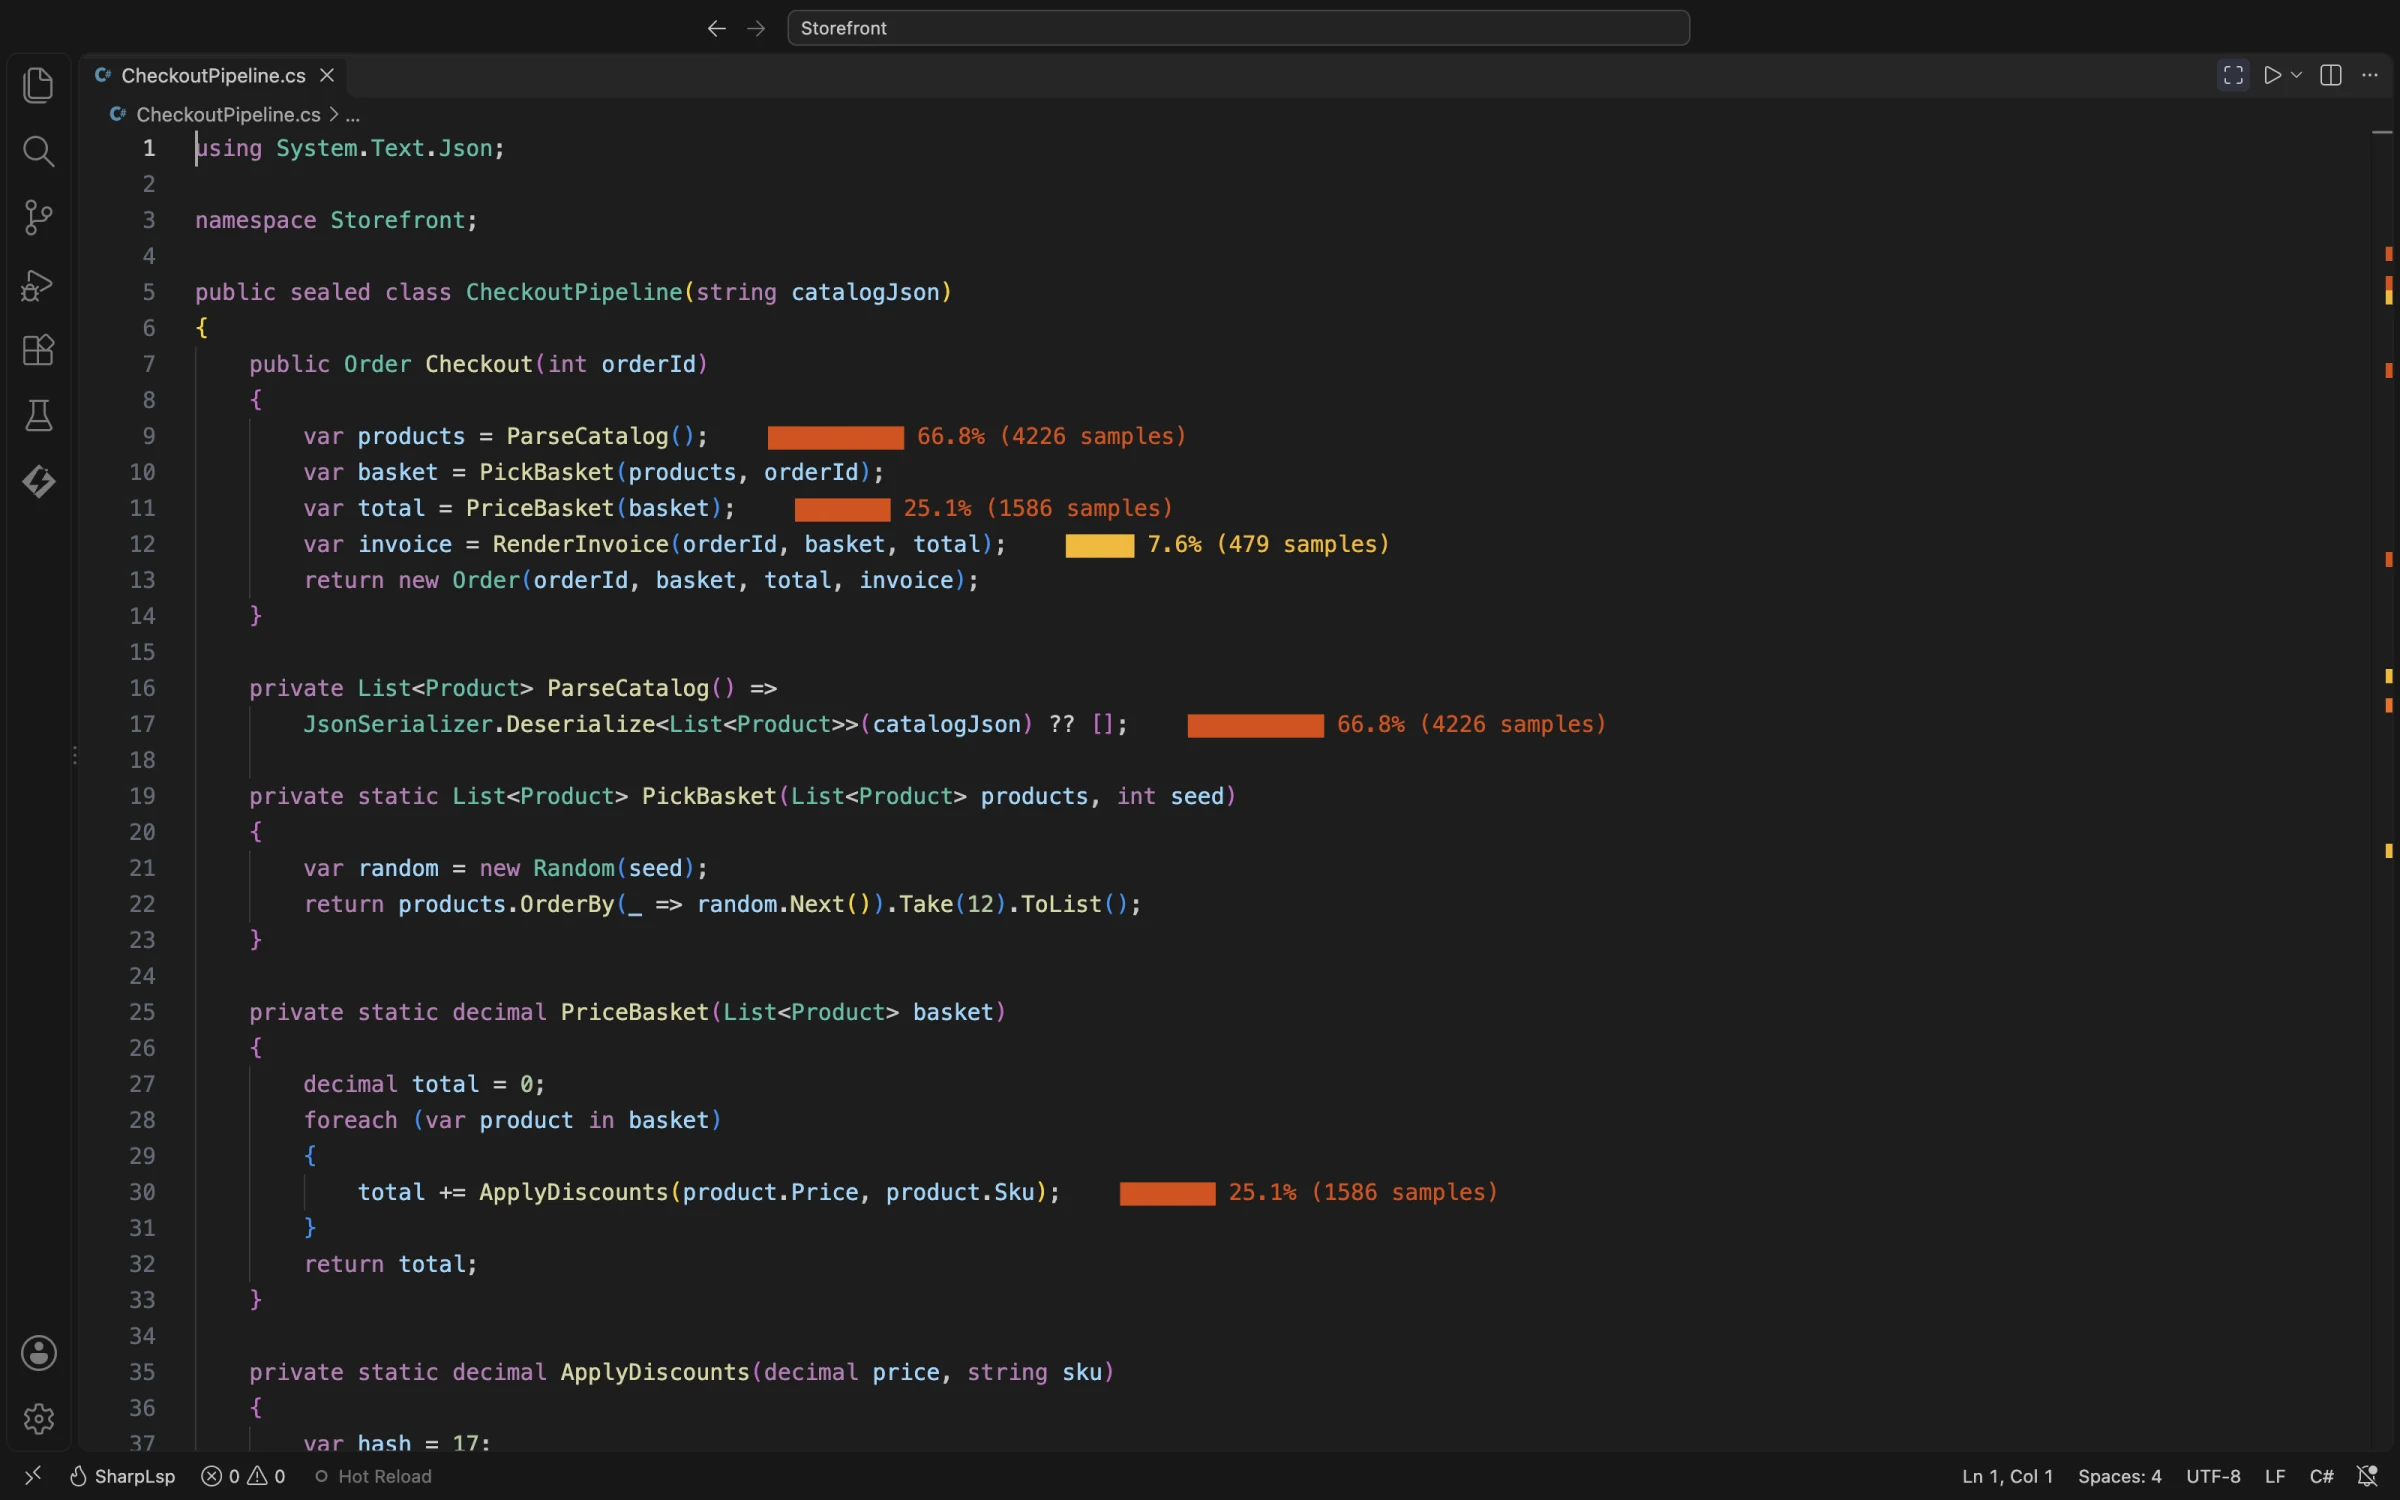
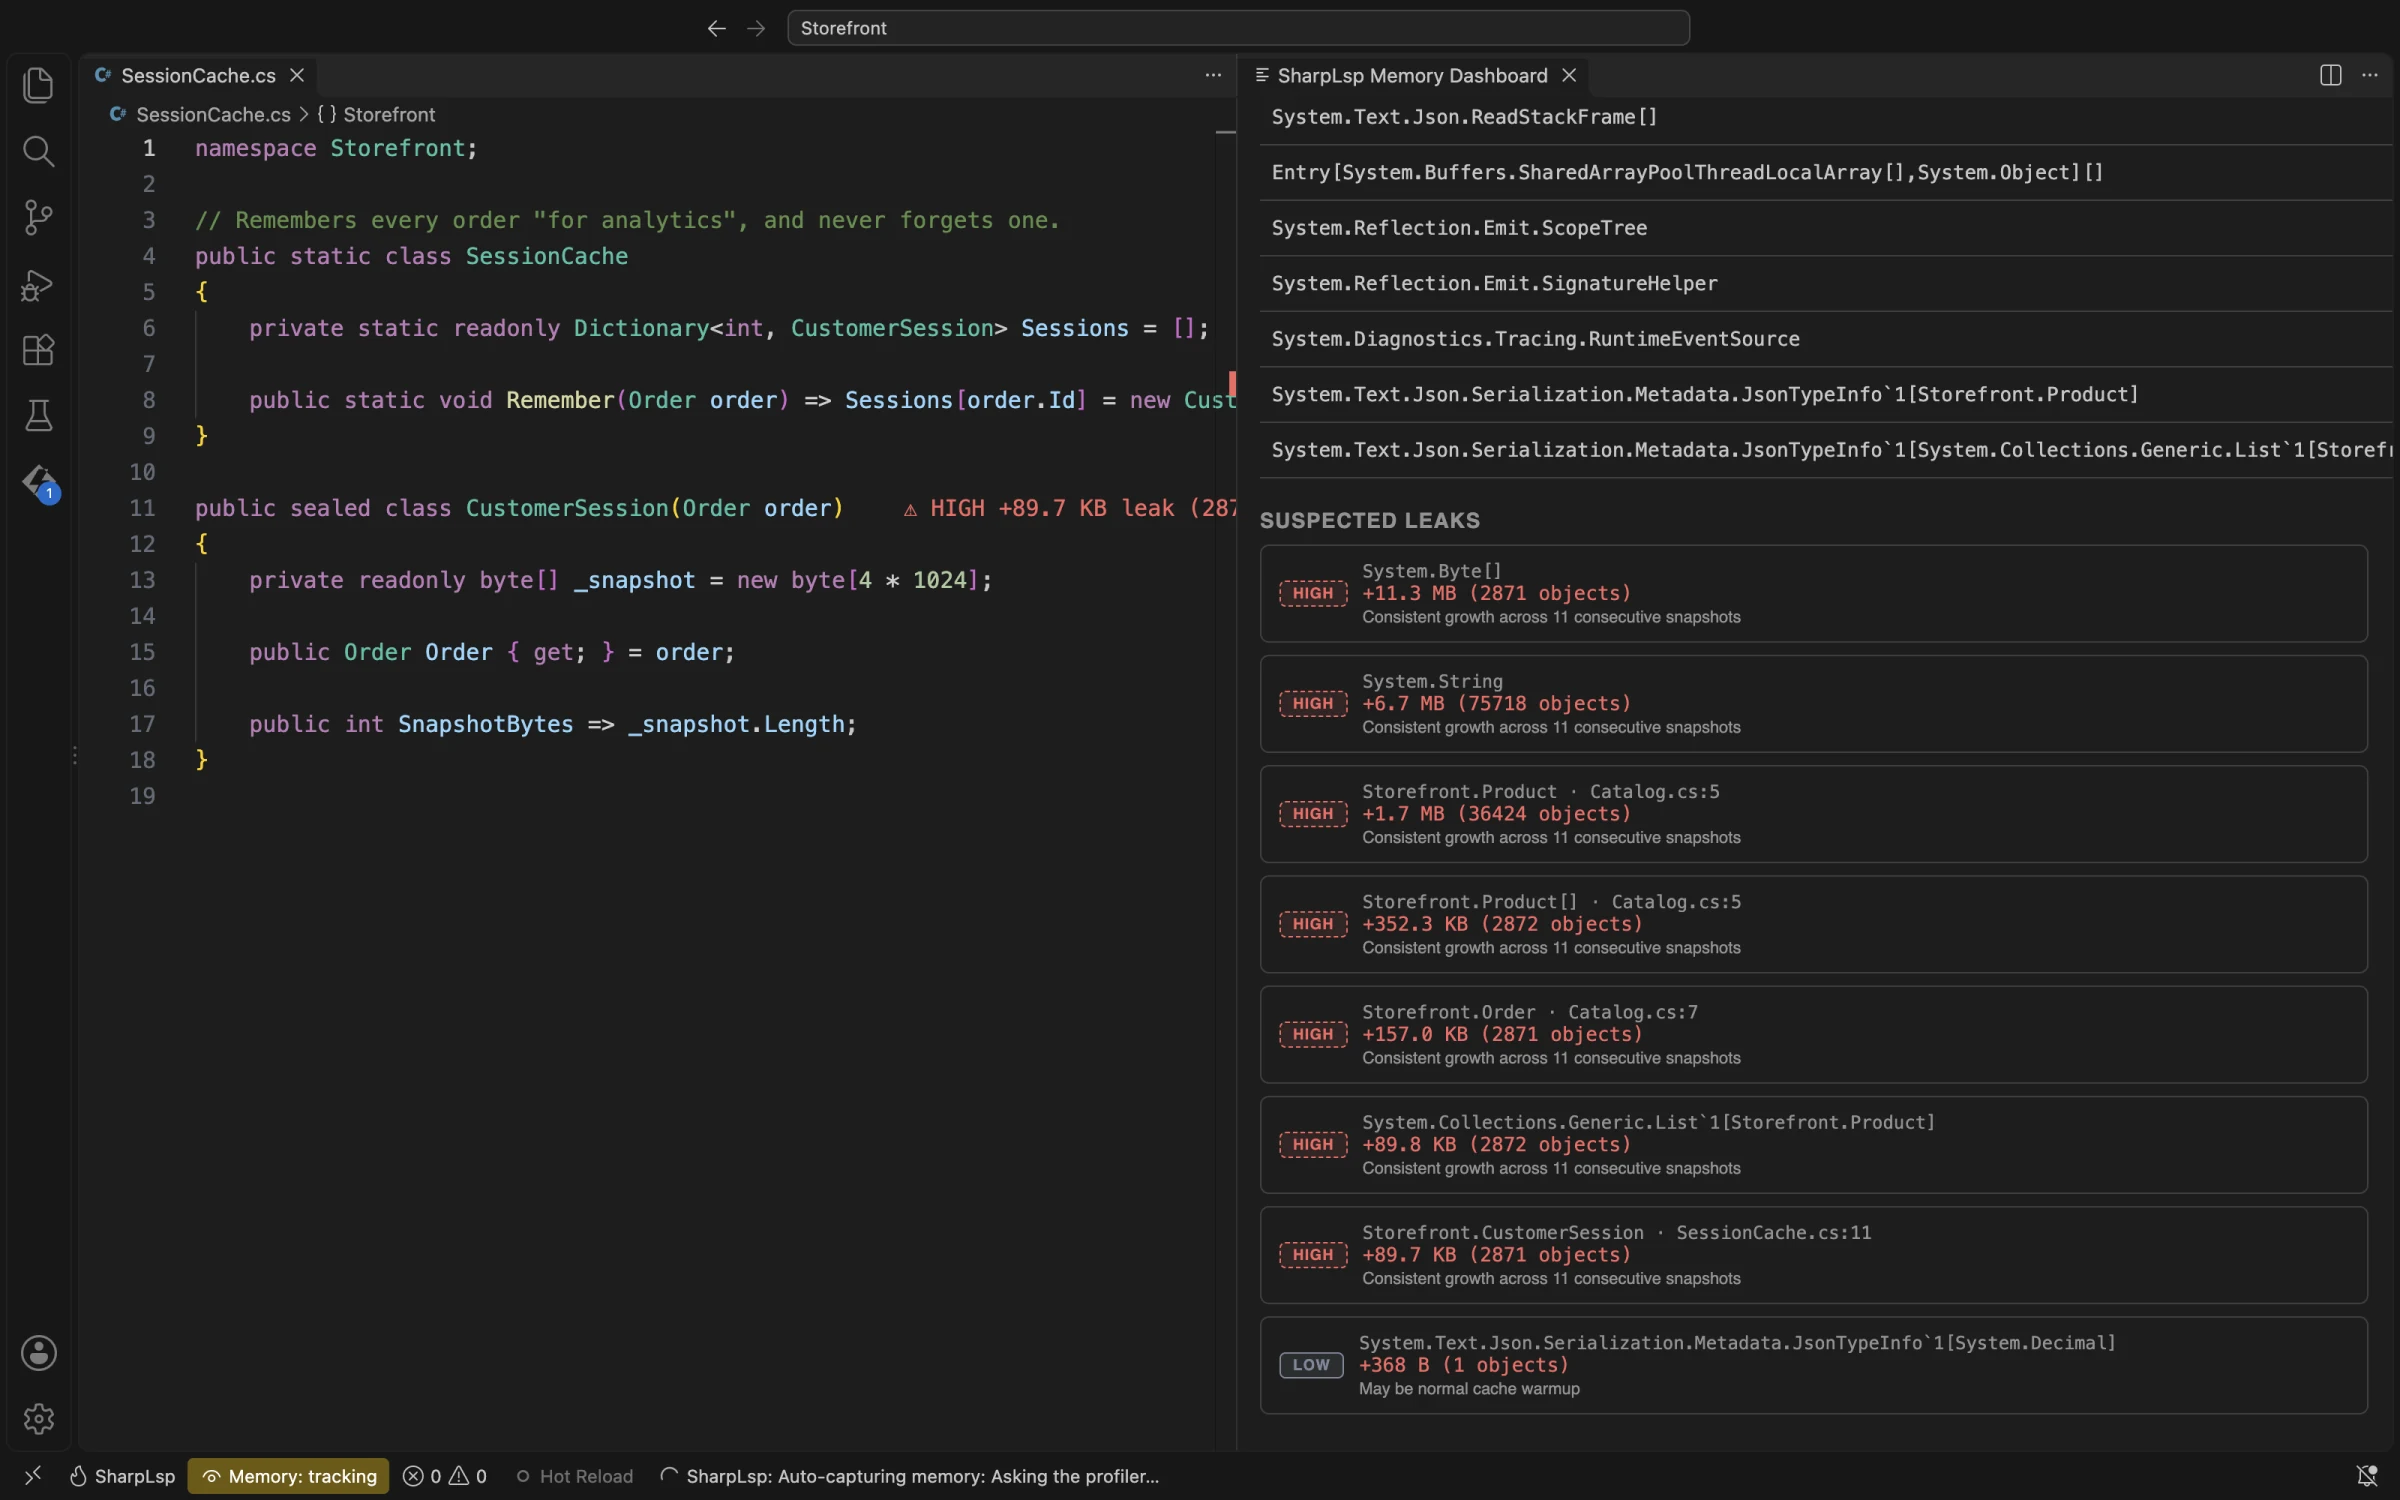
lsp-profiler | Language-neutral CPU and memory profiler: hotspots, flame graphs, speedscope/V8 export, heap snapshots, leak scoring. Spec. |
lsp-profiler-dotnet | The profiler's .NET runtime, using EventPipe. |
@nimblesite/lsp-profiler-ui | The VS Code profiler UI: processes, heat map, flame graph, memory dashboard, retention graph, plus Debug Adapter Protocol test glue. |
Two language servers ship the lspkit profiler in VS Code today. Click a picture to watch it run.
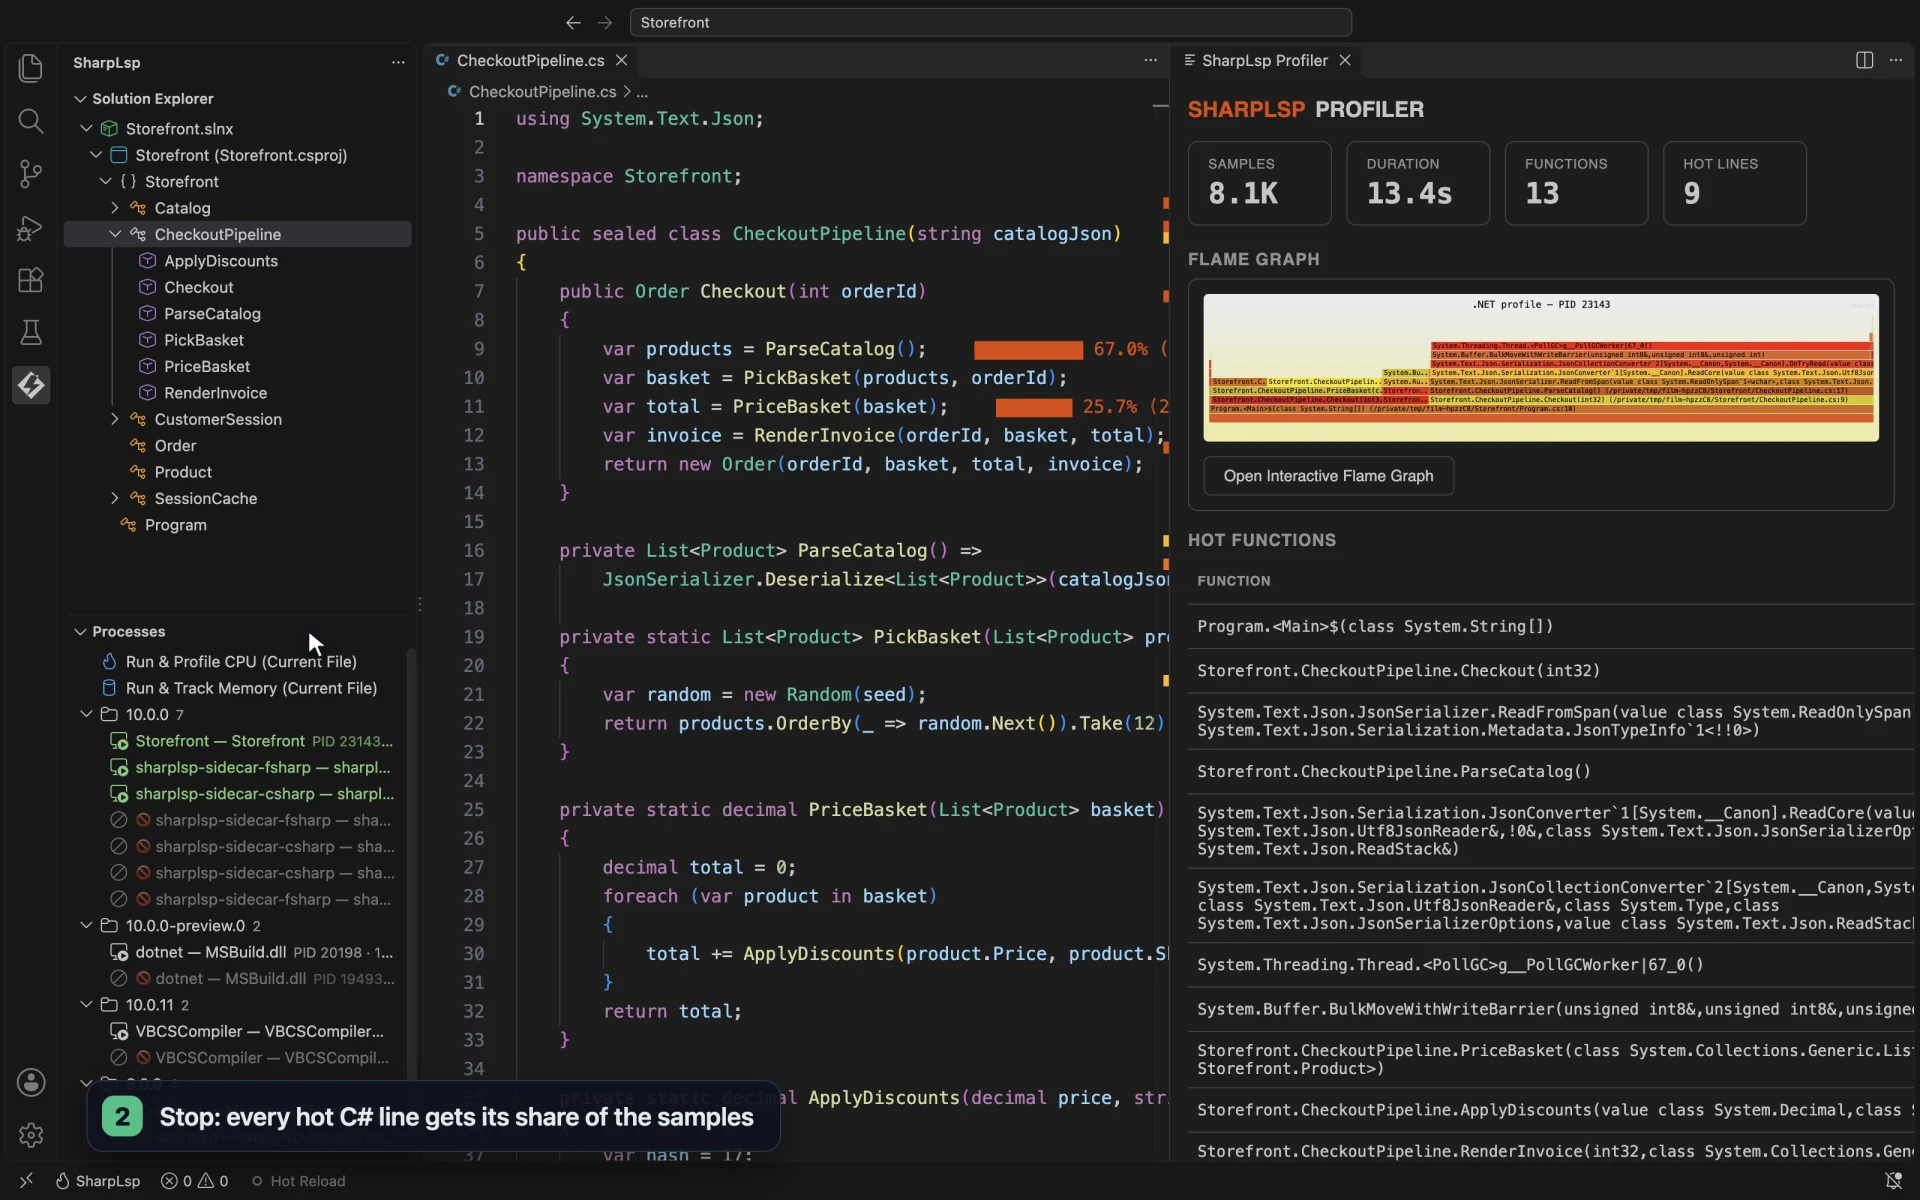
SharpLsp · C# and F# |
Osprey · native functional language |
 |
|
 |
EngineApi is the single boundary between your analysis and the protocols. The LSP backend and the MCP server consume the same engine, so live analysis state is computed once and served both ways. Every report carries a generation number, so clients know which workspace state produced an answer. lsp-profiler-python is parked and unpublished.
make ci      # lint + test + build (full CI simulation)
make test    # fail-fast tests + coverage + threshold
make lint    # cargo clippy -- -D warnings
Behavior contract: docs/specs/lspkit-spec.md. Execution plans: docs/plans/.
MIT — see LICENSE-MIT. © Nimblesite.