An interactive parallel sets visualisation for D3.js.
npm install d3-parsetsimport parsets from "d3-parsets";
import "d3-parsets/style.css";The package is ESM only and includes TypeScript declarations. It imports the D3 v7 modules it uses as dependencies, so a bundler shares them with your own copy of D3. Use that one copy for any transitions on the chart's elements: transitions from separate copies of d3-transition can collide on the same element.
For a script tag, use dist/d3-parsets.min.js, which includes its own copy of those modules and defines the global d3Parsets:
<link rel="stylesheet" href="https://cdn.jsdelivr.net/npm/d3-parsets@3/dist/d3-parsets.css">
<script src="https://cdn.jsdelivr.net/npm/d3-parsets@3"></script>
<script>
  const chart = d3Parsets.default();
</script>
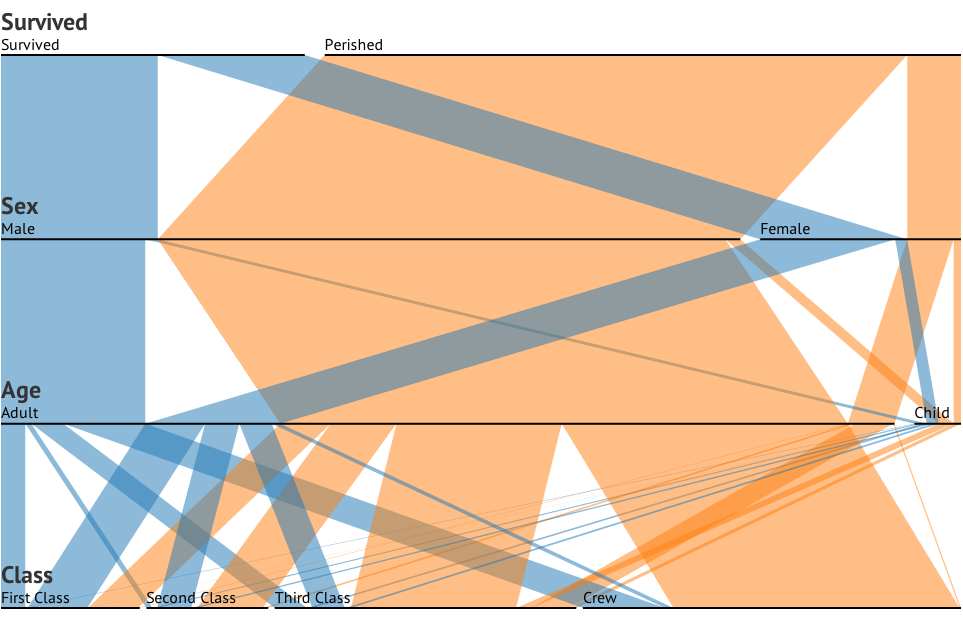
Example: https://www.jasondavies.com/parallel-sets/.
Upgrading from 1.x? See the changelog.
Ribbons are coloured by their category in the first dimension, using the classes category-0, category-1, … The bundled stylesheet defines ten; use color for more. A visible category keeps its colour while the chart is rendered into the same element, so sorting, dragging and rerendering never recolour it. A category that disappears gets its colour back when it returns, unless a new category took that colour in the meantime.
Hovering a ribbon or category highlights the flow through it: its ribbons get the class active, and the other ribbons get the class inactive, which the bundled stylesheet dims.
Functionality based on Parallel Sets by Robert Kosara and Caroline Ziemkiewicz.
# parsets()
Creates a new parallel sets chart with default settings: dimensions are automatically detected and the size is 960×600. The chart is a function that can be called on any D3 selection that has data bound to it. This function can be configured as described below.
Every setting can be set to null to restore its default. Settings that take a function throw a TypeError for anything else, and numeric settings a RangeError for invalid numbers.
A render calls your callbacks, such as formatters, comparators and color, before it changes anything, and so do sorting and dragging. If a callback throws, or the data is invalid, such as a negative value, the error is passed on and the chart on screen is left as it was, still working.
# parsets.dimensions(dimensions)
If dimensions is specified, sets the categorical dimensions to be visualised. If a function is specified, it is invoked for every element in the target selection and an array of dimension names is expected in return. If an array is specified, it should be an array of dimension names (object keys).
Dimensions are always rendered in the order the accessor returns. Dragging a dimension reorders the displayed chart until the next render; to keep a dragged order, store the order passed to the "sortDimensions" listener:
chart.on("sortDimensions.app", order => chart.dimensions(order));If dimensions is not specified, returns the current dimensions. Set to null to restore the default, which uses the keys of the first row in sorted order. A name that appears more than once is shown once.
# parsets.value(value)
Specifies the value accessor. If value is not specified, returns the current value accessor. The default accessor simply returns 1 for each input data element i.e. the absolute frequency count. This value is used to set the width of the horizontal bars and connecting ribbons in proportion to the value.
If the input data is a pivot table, you’ll want to set this to return the aggregate sum for each input data element. You could also use an arbitrary numerical measure instead of frequency if appropriate.
# parsets.width(width)
Specifies the chart width in pixels. If width is not specified, returns the current width, which defaults to 960. Width must be finite and non-negative.
# parsets.height(height)
Specifies the chart height in pixels. If height is not specified, returns the current height, which defaults to 600. Height must be finite and non-negative. To show the dimensions in reverse order, reverse the dimensions array.
# parsets.spacing(spacing)
Specifies the total amount of spacing in pixels to be divided between the horizontal category bars. If spacing is not specified, returns the current spacing, which defaults to 20.
Spacing is capped at the length of each dimension when computing geometry, and must be finite and non-negative. Values returned by the value accessor must also be finite and non-negative; zero-weight categories are omitted. Empty data and single-dimension data are supported.
# parsets.nodeThickness([thickness])
Sets the thickness of the category bars, across their dimension. Defaults to 0, preserving the original lines. With a positive thickness, ribbons attach to the outer edges of each bar. Thickness must be finite and non-negative and is capped to fit the available space without overlapping bars.
# parsets.orientation(orientation)
Specifies the orientation, either "vertical" or "horizontal". If orientation is not speci
8000
fied, returns the current orientation, which defaults to "vertical". A vertical chart stacks the dimensions from top to bottom, with each dimension's categories running from left to right. A horizontal chart places the dimensions from left to right, with categories running from top to bottom and their labels reading up beside their bars; header names are shortened to fit between the columns. It also gives the chart's element the class parsets-horizontal, which the bundled stylesheet uses for the drag cursors.
When the orientation of a rendered chart changes with an animated render, the chart turns a quarter turn: anticlockwise to horizontal and clockwise back, reversing its categories as it turns so that they end in order. Labels fade out, turning with the chart, as it starts to turn, and fade back in at the end, in the new layout. The fading copies are in a g.parsets-turning-labels group, which is removed when the turn ends, or at once when a render stops the turn; their g.dimension and g.category groups have the data of those they copy. A render during a turn carries on from where the turn has reached, including one that turns the chart back. Calling the chart through a transition turns it with that transition's timing:
svg.transition().duration(1000).call(chart.orientation("horizontal"));To turn the chart without its categories moving, reverse their order at the same time, for example with categorySort. The demo does this.
# parsets.tension(tension)
Specifies the tension for the ribbon curves. This should be a value between 0 and 1 inclusive. If tension is not specified, returns the current tension, which defaults to 1 (straight lines).
A tension change animates over the chart's duration, like the other changes made by a render. When the chart is called through a transition, they follow that transition's delay, duration and easing for each element instead:
svg.transition().duration(750).call(chart.tension(0.5));# parsets.duration(duration)
Specifies the duration for the animated transitions in milliseconds. If duration is not specified, returns the current duration, which defaults to 500. Dragging and sorting use the duration the chart had when it was last rendered, so render the chart again to change theirs; a render uses it unless the chart is called through a transition (see tension). When the user prefers reduced motion, every change happens at once, ignoring any duration or delay.
A dimension or category that is still moving when the chart is rendered again carries on as it was, at its own pace, if it ends up in the same place. So a render that only changes the tension, for example, curves the ribbons without restarting a sort or drag that is still moving. Those whose places change move afresh, with the render's timing, as does everything during a turn, to keep in step with it.
# parsets.dimensionFormat(dimensionFormat)
Specifies a formatting function for the dimension name. If dimensionFormat is not specified, returns the current formatting function, which defaults to String. Set to null to restore the default.
# parsets.categoryFormat(categoryFormat)
Specifies a formatting function for the category name shown in the category bars. It is called with the category name, the category's index in its dimension and the dimension name, so categories can be formatted differently in each dimension. If categoryFormat is not specified, returns the current formatting function, which defaults to String. Set to null to restore the default.
# parsets.tooltip(tooltip)
Specifies a formatting function for the ribbon tooltip. If tooltip is not specified, returns the current formatting function, which defaults to:
function(d) {
  var count = d.count,
      path = [];
  while (d.parent) {
    path.unshift(String(d.name));
    d = d.parent;
  }
  return path.join(" → ") + "\n" + comma(count) + " (" + percent(count / d.count) + ")";
}
Tooltip callbacks return plain text. Use newline characters (\n) for line breaks; blank lines and leading spaces are kept, and angle brackets and HTML-like labels are displayed literally. Return null or an empty string to show no tooltip. This applies to both ribbon and category tooltips.
# parsets.categoryTooltip(categoryTooltip)
Specifies a formatting function for the category tooltip. If categoryTooltip is not specified, returns the current formatting function, which defaults to:
function(d) {
  return d.name + "\n" + comma(d.count) + " (" + percent(d.count / d.dimension.count) + ")";
}
# parsets.categorySortKey(sortKey)
Specifies a key accessor used by the "key" category sort control. The accessor is called as sortKey(key, category) and should return a sortable value.
The "key" and "value" controls appear beside a dimension's name on hover. The first click sorts keys in ascending order and values in descending order, largest first, and each further click reverses the order. Each control shows the arrows ↑↓. Once used, it dims the arrow for the order it did not apply, so ↑ shows ascending and ↓ descending, and has the class ascending or descending. The mark lasts while the categories stay in that order, including across renders that keep it, and clears when they are reordered another way.
For example, for weekdays:
var order = new Map([["Mon", 1], ["Tue", 2], ["Wed", 3], ["Thu", 4], ["Fri", 5], ["Sat", 6], ["Sun", 7]]);
chart.categorySortKey(function(key) { return order.get(key) ?? 999; });
# parsets.categorySort([sort])
Sets a function called with each dimension name, returning a category comparator or a falsy value to keep that dimension's categories in data order (the order in which they first appear). Comparators receive category objects with name and count properties. The ordering is applied on each chart render. Dragging and the key/value controls reorder categories interactively until the next render. Set to null to clear it.
chart.categorySort(name => name === "Class"
  ? (a, b) => b.count - a.count
  : null);
To keep interactive category orders across renders, store the order passed to the "sortCategories" listener and sort by it:
const orders = new Map();
chart
  .on("sortCategories.app", (dimension, order) => orders.set(dimension, order))
  .categorySort(dimension => {
    const order = orders.get(dimension);
    if (!order) return null;
    const rank = c => order.includes(c.name) ? order.indexOf(c.name) : order.length;
    return (a, b) => rank(a) - rank(b);
  });
# parsets.color([color])
Sets a function returning the CSS colour for a category of the first dimension. It is called as color(name, index), where index is the category's colour slot (the N in its category-N class), and its result is applied to the category's bar and ribbons as an inline fill and stroke. If no function is set (the default), the category-N classes determine colours. Set to null to clear it.
chart.color((name, i) => d3.schemeTableau10[i % 10]);# parsets.on(type, listener)
Registers the specified listener to receive events of the specified type from the chart. Currently, this includes "sortDimensions" and "sortCategories", which are fired when dimensions or categories are reordered interactively. A "sortDimensions" listener receives the new array of dimension names. A "sortCategories" listener receives the dimension name and its new array of category names.
Omit listener to retrieve the current listener without changing it. Pass null to remove a listener. Event names support namespaces, for example "sortCategories.app". Within a listener, this is the element the interaction happened on.
# parsets.render(data[, parent])
Renders data into a new SVG element sized to the chart, and returns that element. parent is where the SVG is appended: a DOM element, a selector string, or a D3 selection. If parent is omitted, the chart is rendered in a hidden container and the SVG is returned detached, for example to serialise it or insert it later. Throws an error if parent is not found or there is no DOM.
import {parsetsLayout} from "d3-parsets";
// For geometry without importing rendering code:
// import parsetsLayout from "d3-parsets/layout";

const {dimensions, links} = parsetsLayout()
  .dimensions(["Class", "Sex", "Survived"])
  .value(d => d.count)
  .width(960)
  .height(600)
  .nodeThickness(8)(data);
parsetsLayout() returns a configurable function that computes fresh geometry on every call, without a DOM or changes to the input rows. It shares the chart's aggregation and geometry code. Rendering, animation, and interaction remain the caller's responsibility when using this API; the default chart export continues to provide them.
# tree(root, data, dimensions, value)
Aggregates data into a tree of counts and returns root. Each level corresponds to one of the dimensions (an array of names), and value is called as value(d, i) for each row. Pass {children: {}} as root to build a new tree; an existing tree's counts are reset first. Every node below the root has name, count, dimension, parent and children, an object keyed by category name that is null at the last dimension. Throws a RangeError if a value is negative or not finite. Also available as parsets.tree.
import {tree} from "d3-parsets";
const root = tree({children: {}}, data, ["Class", "Survived"], () => 1);
The layout supports .dimensions(), .value(), .width(), .height(), .spacing(), .nodeThickness(), .categorySort() and .orientation(). These follow the chart accessors described above, with these differences:
- Width and height default to 960 and 600.
- There are no header margins. Bars fit inside
[0, height], or[0, width]in a horizontal layout; the first bar starts at zero. - Dimension order follows the dimensions accessor on every call. There is no remembered drag order.
- Empty dimensions produce
{dimensions: [], links: []}. One dimension produces bars and no links.
The returned geometry contains:
dimensions: objects withname,y(bar centre),nodeThickness(effective thickness after clamping), andcategories.categories: objects withname(string),count,x(left edge), anddx(width). Category names are stringified as in the chart; use.categorySort()when a particular order is required.links: one object for each nonzero tree edge between adjacent dimensions, withpath,count,rootCategory,source, andtarget. Distinct upstream paths remain separate even when they connect the same pair of categories.- Each endpoint contains
dimensionandcategoryreferences into the returned geometry,x(offset within the category),dx(ribbon width), andy(attachment coordinate, including the bar thickness).
An endpoint's absolute horizontal position is endpoint.category.x + endpoint.x.
A horizontal layout gives the same geometry transposed, in screen coordinates: each dimension has x (bar centre) instead of y, each category has y (top edge) and dy (height) instead of x and dx, and each endpoint has y, dy and x (attachment coordinate) instead of x, dx and y. Link paths join category names with "\0" and can be used as data-join keys when category names do not contain that delimiter. Spacing is reserved consistently across dimensions so ribbon widths remain comparable, including dimensions with only one category.
The standalone-layout design and per-dimension sorting API were inspired by Michele Mauri's PR #23.
npm ci
npm test                    # aggregation/geometry tests and lint
npm run build:min           # ESM, browser bundle, and CSS
npx playwright install chromium
npm run test:browser        # real-browser interaction regressions
For a working example, run npm run build:min and open test/index.html in a browser, straight from disk. It charts the Titanic's passengers and crew with curve and orientation toggles, and keeps dragged and sorted orders across renders.
Browser tests start their own local server. Set PARSETS_TEST_PORT to change its port, or PLAYWRIGHT_CHANNEL=chrome to use an installed Chrome browser. CI runs unit tests, lint, and builds on Node 22 and 24, and browser tests on Node 24.