Using ChatOps to help Actions on-call engineers
You can multiply the impact of your domain experts by building their common workflows into ChatOps.

At GitHub, we use ChatOps to help us collaborate seamlessly. They’re implemented using our favorite chatbot, Hubot. Running a ChatOps command is similar to running commands on your terminal, except that teammates can see what you ran and see the results if the commands are invoked from Slack. This enables real time collaboration. This is especially useful in handling incidents where the primary goal is to mitigate disruption to users and find the root cause quickly.
Keeping an application healthy isn’t the responsibility of some mysterious service delivery team anymore––the responsibility lies in the hands of the engineers who build it. Besides working on the awesome features you see at GitHub, our engineers also contribute their time to keeping our services healthy and helping customers. Let’s talk about a few days in the life of a new Actions on-call engineer: Mona. We’ll take a look at how Mona responds to a variety of incidents, and you’ll see how ChatOps empowers her to remediate incidents quickly and effectively.
Empowering support and on-call engineers
Mona receives a support ticket from a customer who has been having trouble with a few of their Actions runs.
She sees URLs for the runs in the support ticket, but since they belong to a private repository she can’t access them without customer consent, as a customer privacy measure. She needs to quickly identify ways to find the root cause of the issue and help the customer.
Luckily, we have an automated ChatOps tool called “Hubot” for that! Mona asks Hubot about a URL, and Hubot does the analysis for her.
She is able to identify the issue with no effort, and now she has a huge head start in her investigation.
Behind the scenes, Hubot spins up multiple parallel queries to our log aggregation tool, Kusto, performs complex analysis, and reports back on its findings. In this way, we’ve automated a common support procedure into a handy and secure ChatOps command. As a result, Mona was able to diagnose the issue in a fraction of the time it would have taken her to run the necessary queries herself, and she didn’t even need to provision additional resources or DB access for herself to do so—Hubot took care of all of that for her.
Let’s look at another example in which ChatOps commands helped Mona quickly diagnose the impact of some errors. On another fine day, GitHub Actions runs are failing with an error and Mona wants to quickly find the impact. This is a job for ChatOps!
GitHub Actions telemetry and logs flow into Splunk and Azure Data Explorer (using Kusto Query Language), so Mona can use ChatOps to execute common Kusto queries that help her gain visibility into error logs. Thanks to this ChatOps command, Mona doesn’t have to write the Kusto query herself. All she has to do is execute the ChatOps command, and she’ll get a link to the right query so she can start her investigation.
On-call rotations typically involve analyzing the same things repeatedly—common problems arise with common investigation and remediation steps. This is where ChatOps can help. At GitHub, we take a set of well-defined tasks that we typically perform when incidents occur and codify them into ChatOps. On-call engineers can then reach for these ChatOps tools to greatly increase the speed with which they are able to diagnose and fix issues.
Finding the needle in the haystack
Mona is pretty new to the team, and she loves that there’s a lot of internal documentation on various topics. But soon she realizes there is too much documentation to sort through effectively, especially when remediating high-severity incidents. She is told many times by other engineers on the team, “I know it’s there, but I’m not sure where. It’s definitely somewhere though!” Who can relate?
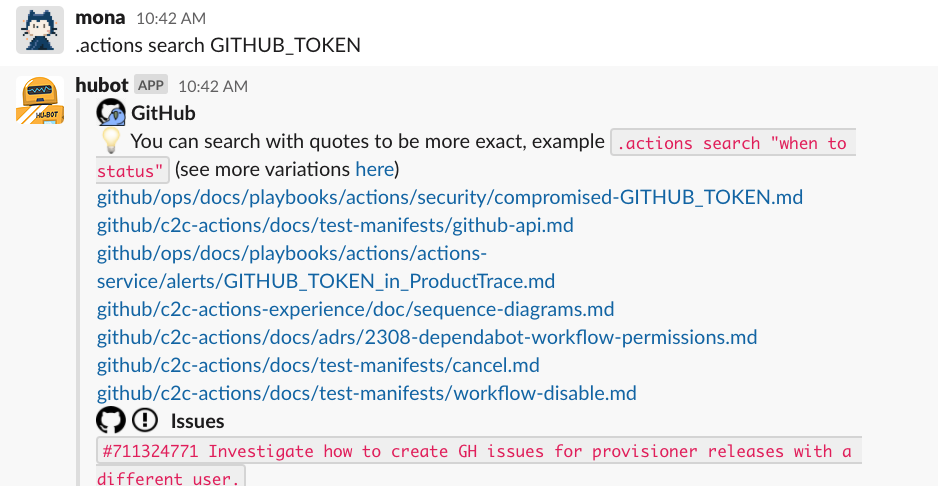
At GitHub, we invest a lot in documentation. We maintain architecture decision records, or ADRs, across different teams. Besides our repository content, sometimes there are treasures hiding in GitHub Issues. It can be hard to find relevant documentation efficiently, especially information relevant to a specific team, like the GitHub Actions team. This is another place where ChatOps helps. We have a ChatOps command that searches only repositories that are relevant to the Actions team and shows the relevant docs.
This ChatOps command helps her during on-call shifts as well. In another incident, automated failover of the database isn’t working, and Mona has to manually failover the database. She is sure the instructions she needs are somewhere, but where exactly? Mona types a quick .actions search failover database command into Slack.
Voilà! The playbook has been served! A playbook is a set of manual steps for troubleshooting a production issue.
Automating playbooks
Mona has now found the playbooks, but she is overwhelmed by the information.
Just like every service within GitHub, GitHub Actions has its own well-defined SLOs (service level objectives).GitHub’s SLOs are behavior-based rather than resource-based.
However, we also use resource-based alerts, and these sometimes help in quickly root-causing a symptom-based alert. For example, one alert we might see is our “run start delay” SLO signal coupled with high CPU alerts on one of our databases. That is a very solid path toward mitigating and root-causing the incident.
Mona is paged due to a resource-based alert, “database is unhealthy.” There is a lengthy playbook on logical steps to execute for finding the root cause. There could potentially be a wide range of impact from this, and this is not the time to go through manual steps in the playbooks.
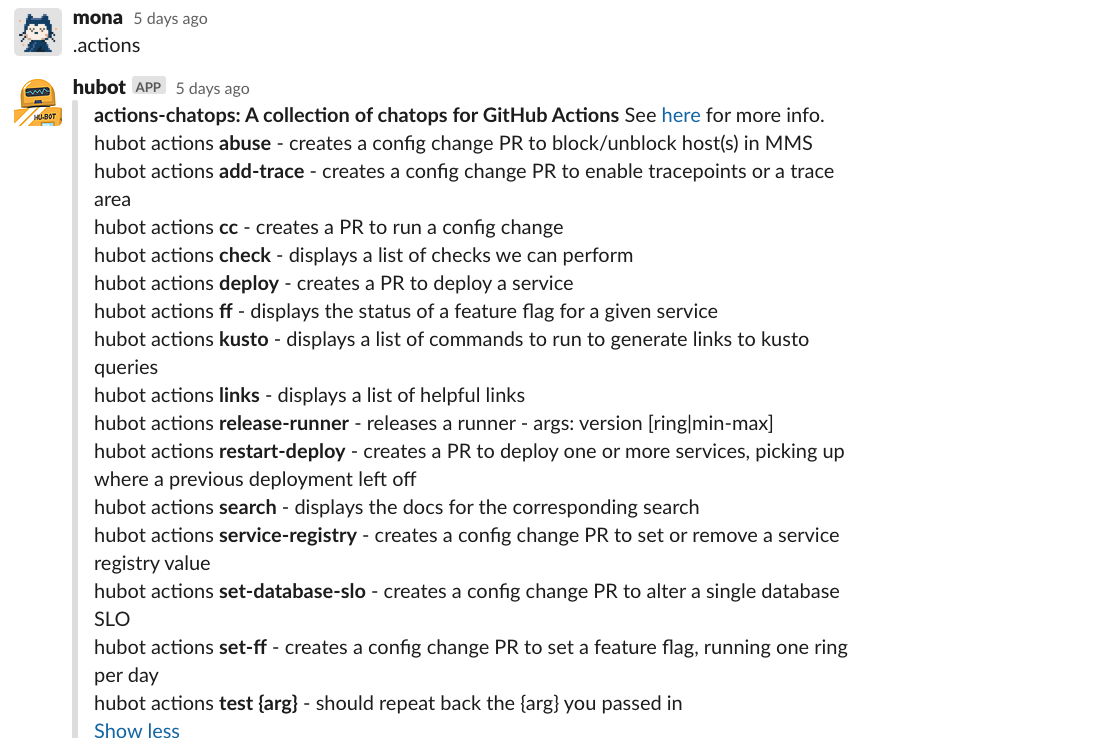
She tries to figure out if there is a ChatOps command that would help her by invoking .actions
One of the results that Hubot returns, .actions check, seems interesting. Mona wants to check the health of the database and learn more about the issues that are happening.
She invokes help for that command with .actions check help.
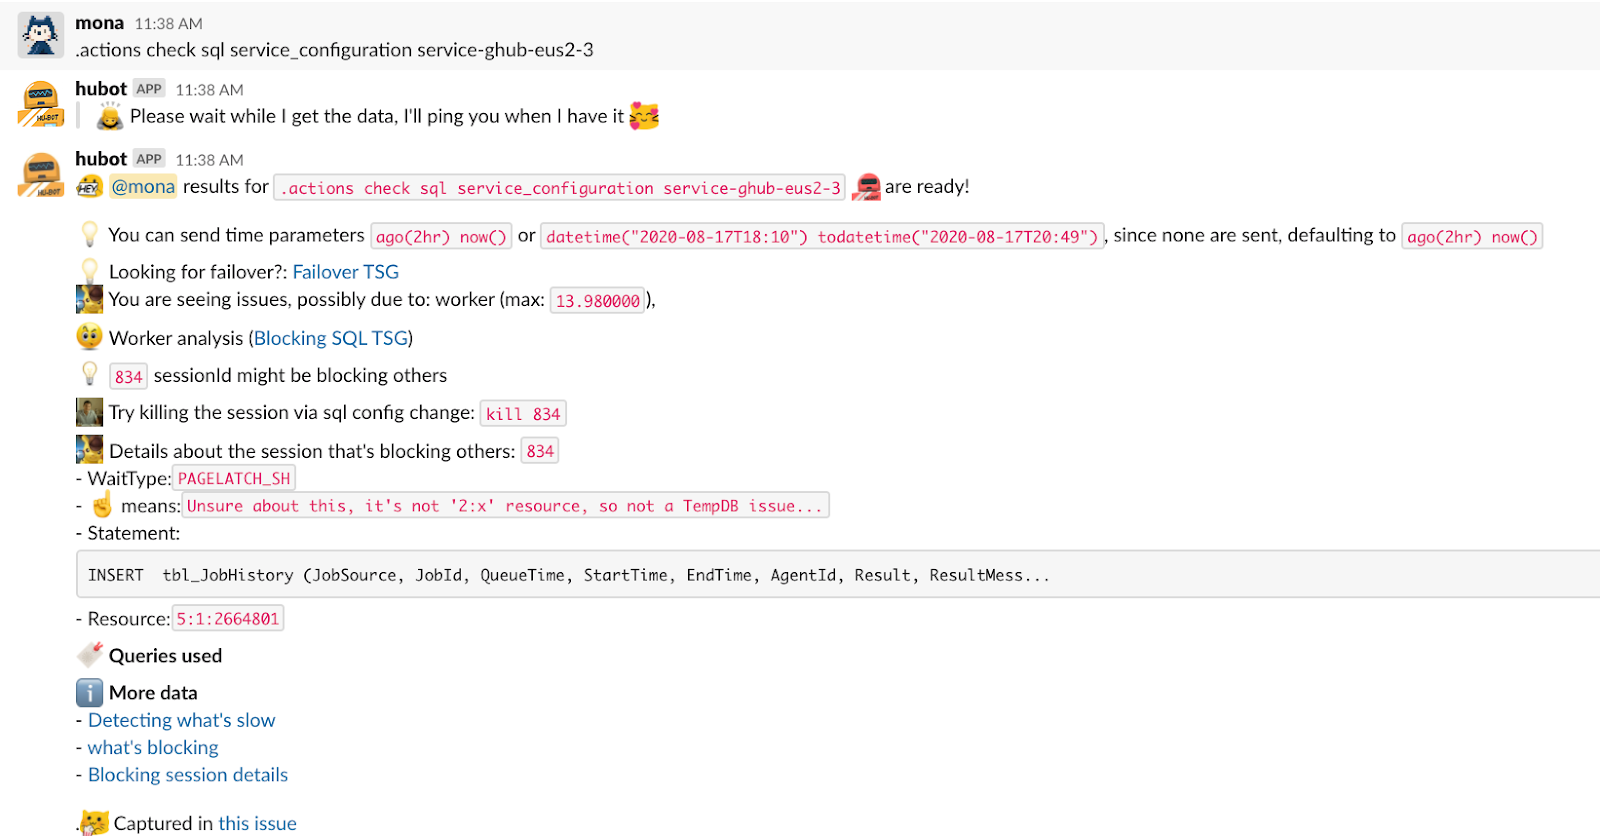
Near the bottom of the list is the sql command, which is exactly what she wants! She then executes the command for the specific database:
The root cause is served: worker percentage is high. A single session is blocking others and is waiting on PAGELATCH_SH.
This particular analysis is a simple anomaly-based analysis. Mona looks at the CPU, memory, and worker percentage data between the requested time period and compares that with historic data by using IQR to find outliers. Hubot then switches to analysis of that specific resource and digs in further to find the potential root cause. In the end, Hubot suggests possible mitigation steps and links all resources and queries to do any further analysis.
When there is an active production issue affecting customers, the focus of on-call is to quickly mitigate and root cause. There are always subject matter experts who know more about certain aspects of the code than anyone else, and their mitigation steps and deep insights into potential root causes are generally documented in playbooks. However, during an incident, following the playbook can be challenging. Playbooks can turn out to be huge, with various logical steps for investigation. More and more of GitHub’s incident response activities are moving from static playbooks to ChatOps.
It’s scenarios like these where ChatOps shines. Subject matter experts codify their knowledge by building their time-tested debugging practices into re-usable ChatOps that any on-call engineer can quickly and easily take advantage of. This gives a huge head start to on-call, and they can then take the analysis further and contribute back to the ChatOps, making it even better!
In short, these kinds of reports give a crucial jump-start for on-call and help prevent customer impact with early detection and mitigation.
Looking to the future
You can multiply the impact of your domain experts by building their common workflows into ChatOps. As more and more engineers take advantage of ChatOps during their on-call rotation, ChatOps will get iterated on again and again. In this way, ChatOps can become a sort of living incident playbook that speeds up incident investigation and remediation.
Besides helping the company grow, ChatOps also saves domain experts from doing the same tasks repeatedly. And it’s not just about root cause analysis—we also use ChatOps to deploy, perform mitigations, recycle VMs, upgrade databases, and much more!
If you share the same vision, join us in leveraging ChatOps as living incident playbooks and you’ll see the quality of life for on-call engineers go up, while the time it takes to remediate incidents goes down.
Written by
Related posts

GitHub Enterprise Cloud with data residency: How we built the next evolution of GitHub Enterprise using GitHub
How we used GitHub to build GitHub Enterprise Cloud with data residency.

The ultimate guide to developer happiness
Five actionable tips and strategies to supercharge developer happiness—and a more innovative workplace.

How GitHub supports neurodiverse employees (and how your company can, too)
Teams with neurodivergent employees can be up to 30 percent more productive. Discover tips on how best to support them in your workplace.


