| title | Metrics |
|---|

Railway allows you to see resource usage information related to your deployments within a service.
We provide the following graphs 36B5 that provide insight into your application's load to help you diagnose application performance.
- CPU
- Memory
- Disk Usage
- Network
When you view your project's metrics, we show you the graphs tied to the selected environment in your service's metrics tab.
We currently keep 7 days worth of metrics data.
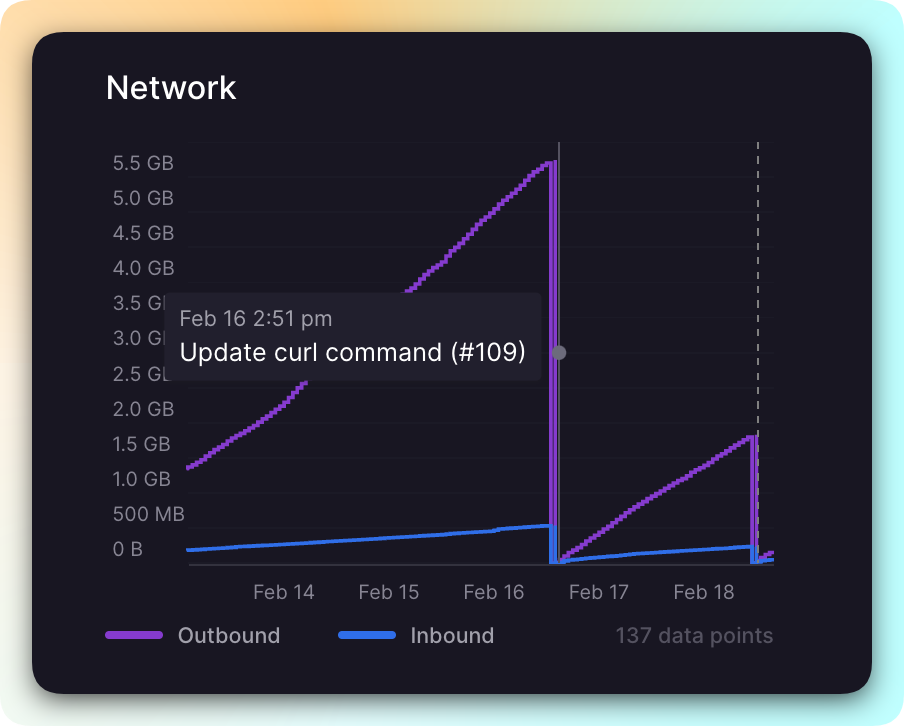
Your project maintains a continuous timeseries for all your deployments within a service, not just the latest one. Deployments appear on the graph so you can see which commit may have caused a spike in resources.